AI & Predictive Analytics in Healthcare: Tools That Save Lives
A predictive model is only useful if it changes what happens to a real patient. In hospitals, that usually means one thing:the right action, earlier And it must happen inside the workflow clinicians already use.
Real Story - TREWS sepsis alert in theEHR
A patient came into the ED with vague symptoms. Mild fever. Slightly high heart rate. Labs were still “not terrible.” Nothing was screaming sepsis yet, and the team was juggling multiple sick patients.
Then a sepsis alert fired in the EHR. It was TREWS, a real-time model deployed at Johns Hopkins. In the published evaluation, TREWS flagged sepsis about 1.8 hours before usual clinical recognition, and the alert required a clinician acknowledgment inside the EHR workflow (Adams et al., NatureMedicine, 2022). In that same study, when clinicians responded within 3 hours, antibiotics were given earlier and mortality fell by about an 18% relative reduction (Adams et al., Nature Medicine, 2022). That is the point of predictive analytics:not “a score,” but a changed timeline.
The industry is shifting from retrospective risk calculators to tools embedded in Epic- and Cerner-style workflows.Instead of reviewing dashboards at the end of the week, teams get signals at the moment decisions are made. That shift is also why adoption is hard. Real-time alerts can create alert fatigue if they are noisy. A good tool is not the one with the best chart. It is the one that leads to fewer complications.
What is Predictive Analytics in Healthcare
Predictive analytics in healthcare is not a buzzword anymore. It is now part of clinical operations, quality programs, and care management. But the core idea is still simple.
Predictive analytics in healthcare means using past and real-time data to estimate a patient’s future risk. The goal is early action: earlier antibiotics, earlier consults, earlier discharge planning, or earlier follow-up.
Every predictive workflow has three layers.
1) Data in
· EHR vitals, labs, meds, orders
· Claims history and utilization
· Social risk signals (screeners or area-level proxies)
· Wearables or remote monitoring feeds
· Clinical notes (via NLP)
2) Model
· Classic regression risk scores
· ML models (tree-based, deep learning)
· NLP models for free text
· Multimodal models combining imaging + clinical data
3) Output
· Risk score in a chart
· Worklist ranking for case managers
· Alert (interruptive or non-interruptive)
· Recommendation tied to an order set or pathway
In my experience working with implementation teams, the “output” design is where most value is won or lost. If the prediction does not clearly map towho does what next, it becomes background noise.
Real-Time vs Batch Predictions:
Timing changes everything in predictive analytics. The difference between real-time and batch predictions determines how quickly teams can act and how disruptive the tool is to workflow.
Real-time models support immediate bedside decisions and are typically embedded inside the EHR. Examples include sepsis early warning, AKI risk in the ICU, inpatient deterioration or ICU transfer risk, and hypoglycemia risk during insulin changes. Because these scenarios are time-sensitive, alerts may require clinician acknowledgment, as seen in the TREWS evaluation (Adams et al., Nature Medicine, 2022). The goal is rapid intervention - earlier antibiotics, labs, or escalation. These tools can improve outcomes, but must be carefully calibrated to avoid alert fatigue.
Batch predictions update on a daily or weekly basis and usually generate worklists rather than interruptive alerts. Common examples include 30-day readmission risk, no-show risk, chronic disease decompensation risk, and high-cost utilization forecasting. These models are less disruptive and work best when paired with outreach capacity such as care management or pharmacy follow-up. The impact depends on whether teams act on the prioritized list.
Most health systems prioritize a focused set of high-impact use cases when evaluating predictive analytics tools. These typically include readmission reduction, sepsis recognition, AKI prevention, length-of-stay optimization, deterioration and ICU transfer risk, medication adherence and no-show risk, and chronic disease management for conditions like heart failure, COPD, and diabetes. These areas persist because they are measurable, clinically meaningful, and tied to quality and financial outcomes.
A “tool” may be an EHR-native model, a third-party analytics platform, or a custom-built ML system. The right choice depends on your data maturity, governance capacity, and whether you need real-time bedside support or population-level risk management. Ultimately, the best tool is not the most complex algorithm. It is the one that integrates smoothly into workflow, is governed safely, and leads to measurable improvements in patient outcomes.
Tool Types: EHR-Native, Third-Party, and Custom Models
Healthcare predictive analytics tools generally fall into three categories. EHR-native models are built directly into systems like Epic or Cerner, making workflow integration easier, though they still require local validation and monitoring. Third-party platforms connect multiple data sources - such as EHR, claims, SDOH, and remote monitoring and offer stronger data infrastructure, but often require more integration effort. Custom ML stacks provide the most flexibility for specialized use cases, but they demand mature data pipelines, governance, and ongoing performance oversight. Many organizations start with EHR-native tools for speed and expand as their data capabilities grow.
Data Sources Behind Patient-Outcome Predictions
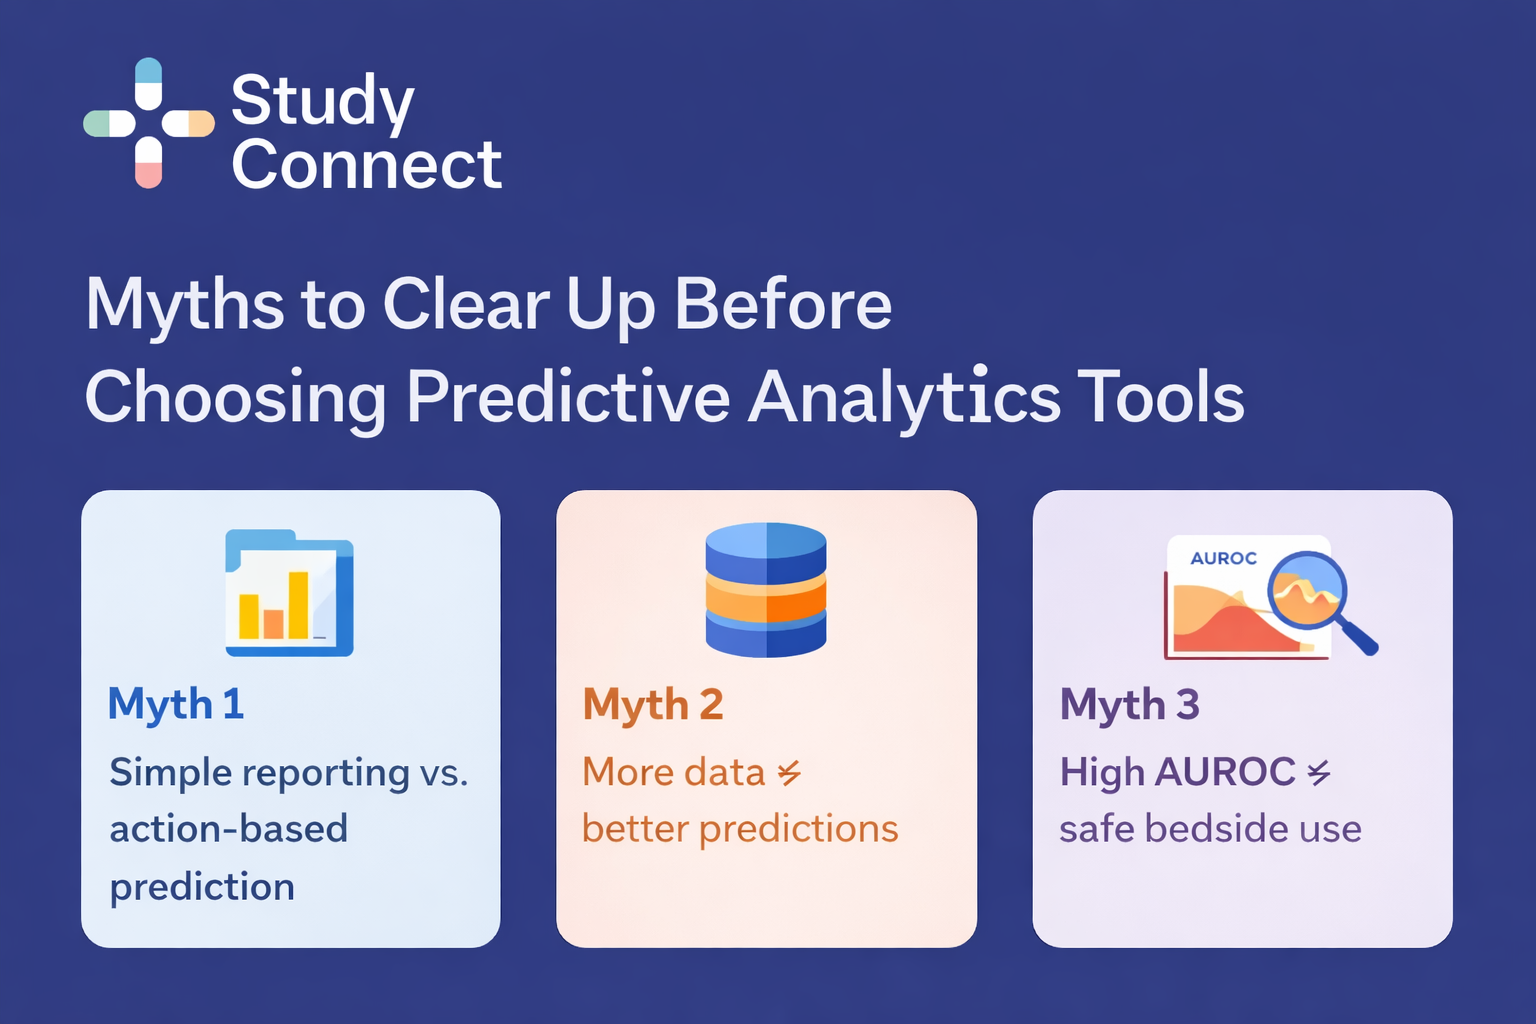
Most predictive models combine structured EHR data like vitals, labs, medications, and clinical history with broader inputs such as claims, SDOH indicators, wearable data, and clinical notes analyzed through NLP. The key is not just more data, but relevant and reliable data aligned to the specific outcome being predicted.
Predictive tools typically generate risk scores, alerts, care pathway recommendations, or dashboards. Risk scores help prioritize patients, alerts support urgent action, care pathways standardize next steps, and dashboards monitor outcomes and drift. Importantly, outputs should include basic “why” information so clinicians understand the drivers behind a flag and can act confidently.
Where AI data analytics tools fit (ML, NLP, Imaging,Genomics)
Modern predictive analytics is no longer only structured EHR fields.
· NLP from notes can capture symptoms and clinician concern not coded elsewhere.
· AI imaging flags can identify risk earlier in the pathway. A real-world example: an AI smartphone app for lung disease screening in Karnataka was reported to show high accuracy in validation by AIIMS, highlighting that these tools are being clinically assessed and implemented (Economic Times report: “AIIMS finds high accuracy…”, source in references).
· Genomics and multimodal oncology models can support response and toxicity prediction, but need strong pipelines and careful generalizability testing.
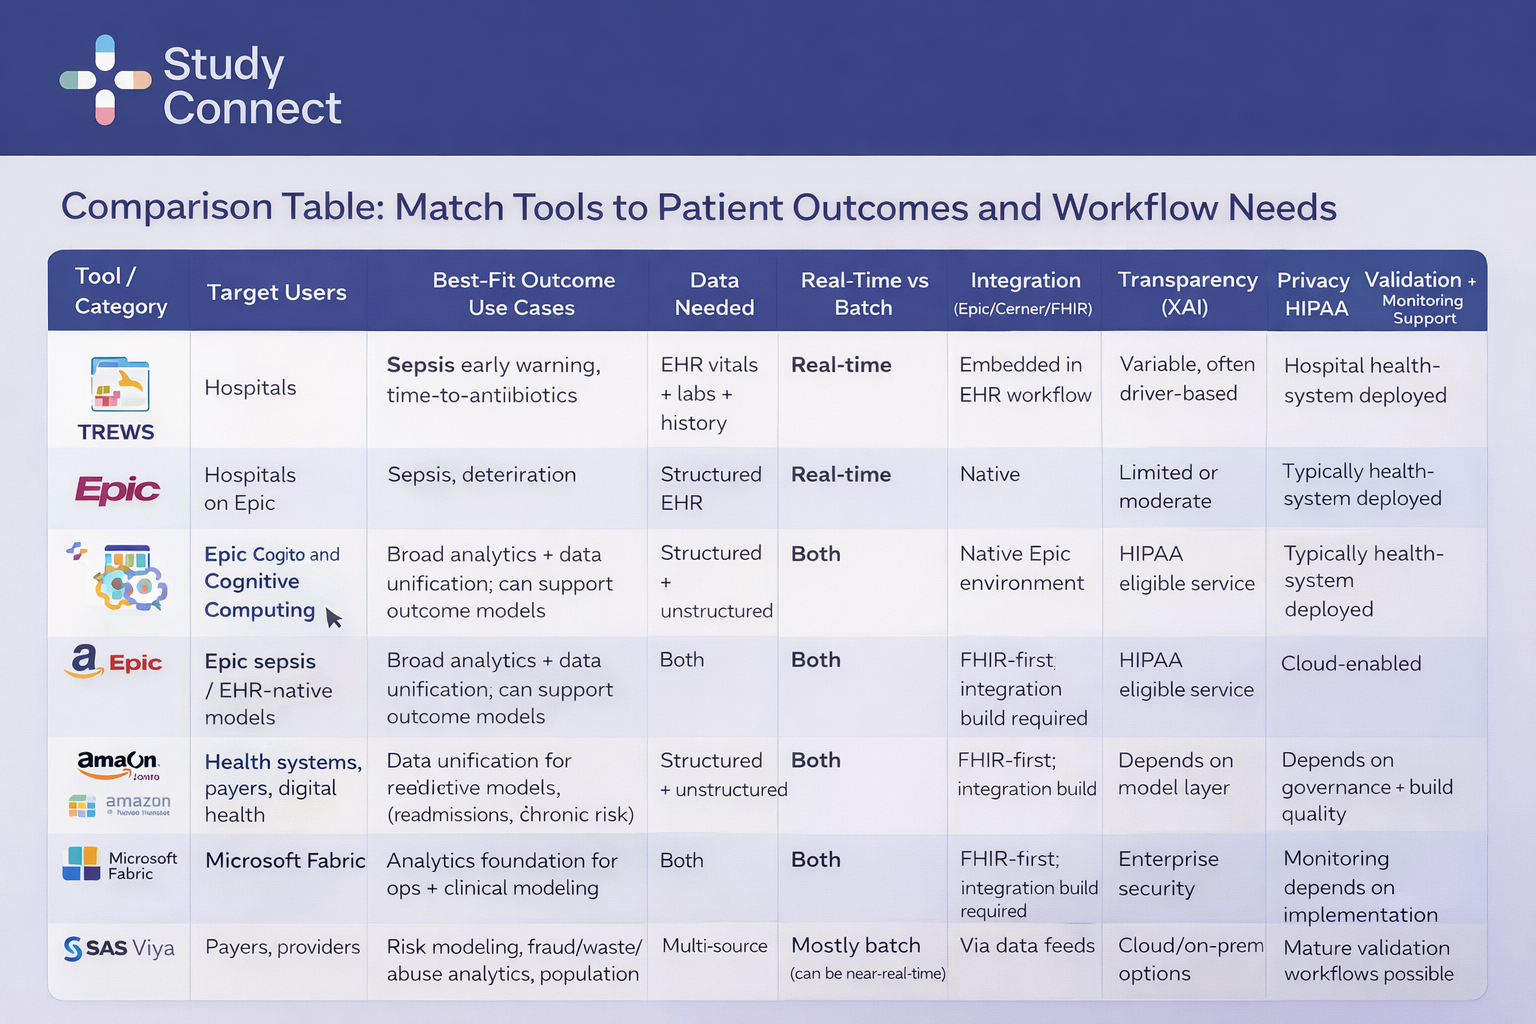
How to Use This Table
Start with your outcome. Define what you are trying to improve, then select the tool category that aligns with your timing needs (real-time vs batch) and your integration capacity within Epic, Cerner, or FHIR-based systems.
Sepsis Early Warning Tools (TREWS and EHR-Native Models)
Sepsis is the clearest example where timing drives outcomes. TREWS, embedded directly in the EHR, identified sepsis approximately 1.8 hours earlier than usual recognition in the Johns Hopkins evaluation (Adams et al., Nature Medicine, 2022). When acted on within three hours, mortality fell by about 18% relative reduction, with earlier antibiotic administration. These tools are best suited for hospitals with established sepsis pathways and rapid response capability. However, thresholds must be carefully managed to prevent alert fatigue, and performance must be monitored for calibration drift. EHR-native sepsis models, such as those in Epic, offer easier workflow integration. But “native” does not mean validated — local calibration and ongoing monitoring remain essential.
Readmission and Care Management Models
Readmission models function best as prioritization tools rather than interruptive alerts. They combine inpatient history, utilization data, claims, medication adherence, and social risk signals to generate ranked work lists for care managers. Impact should be measured through 30-day readmissions, follow-up completion rates, ED revisits, and medication fills. The prediction only adds value if outreach capacity exists to act on it.
Acute Kidney Injury (AKI) Prediction
AKI models use creatinine trends, urine output, nephrotoxin exposure, and co-morbidities to flag early risk. In practice, they support medication adjustments, repeat labs, hydration plans, or nephrology consults. They work best in units with structured prevention bundles. Monitoring should track not just AUROC, but unnecessary interventions triggered by false positives.
Chronic and Remote Monitoring Prediction
Remote monitoring models must translate wearable data into clear clinical action. For example, AI-driven “digital twin” approaches like Twin Health combine wearable and clinical data to improve diabetes management. The key requirement is routing and escalation. Without a defined pathway, more data does not improve outcomes.
Precision Oncology Prediction
Oncology models increasingly combine genomics, imaging, pathology, and longitudinal EHR data. These tools typically support tumor board decision-making rather than interruptive alerts and aim to personalize therapy while reducing toxicity. Because of their complexity, they require strong data pipelines and rigorous cross-site validation
Healthcare Analytics : Use Cases that Directly improve Patient Outcomes
Outcomes improve when prediction shortens time to action, or improves targeting. If your model does neither, it is are porting tool wearing an AI label. Here is what good looks like by use case.
Early Deterioration and Sepsis: Reducing Time-to-Antibiotics and Organ Failure
Sepsis is the clearest example of outcomes tied to time.
TREWS showed earlier recognition by ~1.8 hours and improved outcomes when acted on quickly (Adams et al., NatureMedicine, 2022).
That is the pattern to replicate: early flag + clear pathway + measurable timeline.
Success metrics
· Time-to-antibiotics
· Time-to-IV fluids (when appropriate)
· ICU transfers and rapid response events
· Organ dysfunction progression
· Mortality
Length of stay (LOS) and Capacity: Predicting Discharge Barriers
LOS prediction is operational, but it still touches patient outcomes. Delayed discharge increases risks like de-conditioning, hospital-acquired infections, and medication errors.
Useful LOS features
· Mobility status and therapy needs
· Pending imaging or procedures
· Social barriers (transport, caregiver availability)
· Post-acute placement needs
Good Outputs
· A discharge barrier checklist surfaced early
· Case management worklist that update daily
· Clear ownership: who resolves which barrier
Medication Adherence & No-Show Risk
Many deterioration events happen because patients cannot follow the plan.
What models can flag
· Likely no-shows for follow-up
· Non-adherence risk for key meds(HF, diabetes, anticoagulation)
· Barriers like transport and cost
What“actionable” looks like
· Automated reminder workflows
· Transport support referrals
· Pharmacy outreach or medsynchronization
· Prioritized nurse calls for highest-risk patients
SDOH-enhanced risk stratification
Adding SDOH data can improve targeting, but it must be used transparently. ZIP-code proxies can encode historical inequities if you do not monitor fairness.
Best Practices
· Treat SDOH as a “needs” signal, not a denial signal
· Show clinicians what was used
· Run subgroup performance checks before and after go-live
Benefits of Predictive Analytics
Predictive analytics is growing because it can improve outcomes and reduce waste. But the benefits only appear when models are deployed safely and measured honestly. This section keeps it practical.
Predictive analytics can support:
· Earlier detection of sepsis,AKI, and deterioration
· Fewer complications through earlier interventions
· Better targeting of transitional care to reduce readmissions
· More personalized chronic disease follow-up
· Safer monitoring for high-risk medication regimens
When designed well, predictive tools:
· Reduce cognitive load by ranking risk
· Route work to the right role(nurse, pharmacist, case manager)
· Provide a short “why” that clinicians can sanity-check
Financial and Operational Benefits
Hospitals also pursue predictive analytics for efficiency, but outcomes must remain the priority.
A market report forecasts the global healthcare predictive analytics market will reach $128.2 billion by 2033, growing at about ~24.3% CAGR, driven by AI/ML across clinical, operational, and financial analytics. Market forecast for healthcare predictive analytics growth . Separately, one industry report notes leading U.S. hospitals expect up to ~20%cost reductions by 2026 through predictive AI for resource use, patient flow forecasting, and operational planning (https://medtechgrowths.com/ai-in-healthcare/predictive-ai-hospital-roi-2026/?utm_source=chatgpt.com). Treat these as directional signals, not guaranteed ROI. The only defensible ROI story is outcomes + adoption + sustained performance.
Limits, Ethics, Bias, & Safety:
Models fail in predictable ways. Most failures are not “bad AI.” They are weak validation, poor monitoring, or misfit workflows. Plan for failure modes from day one.
Common reasons models break:
· Data drift: patient mix changes(seasonality, COVID-like shifts)
· Outcome drift: clinical definitions and pathways change
· Prediction drift: risk score distribution shifts over time
· Label problems: “who got tested” becomes the target instead of “who was sick”
· Local mismatch: one site’s documentation and labs differ from another
This is why sepsis model performance can vary by hospital and why site-specific calibration matters. Even widely deployed models can under perform in certain populations without recalibration.
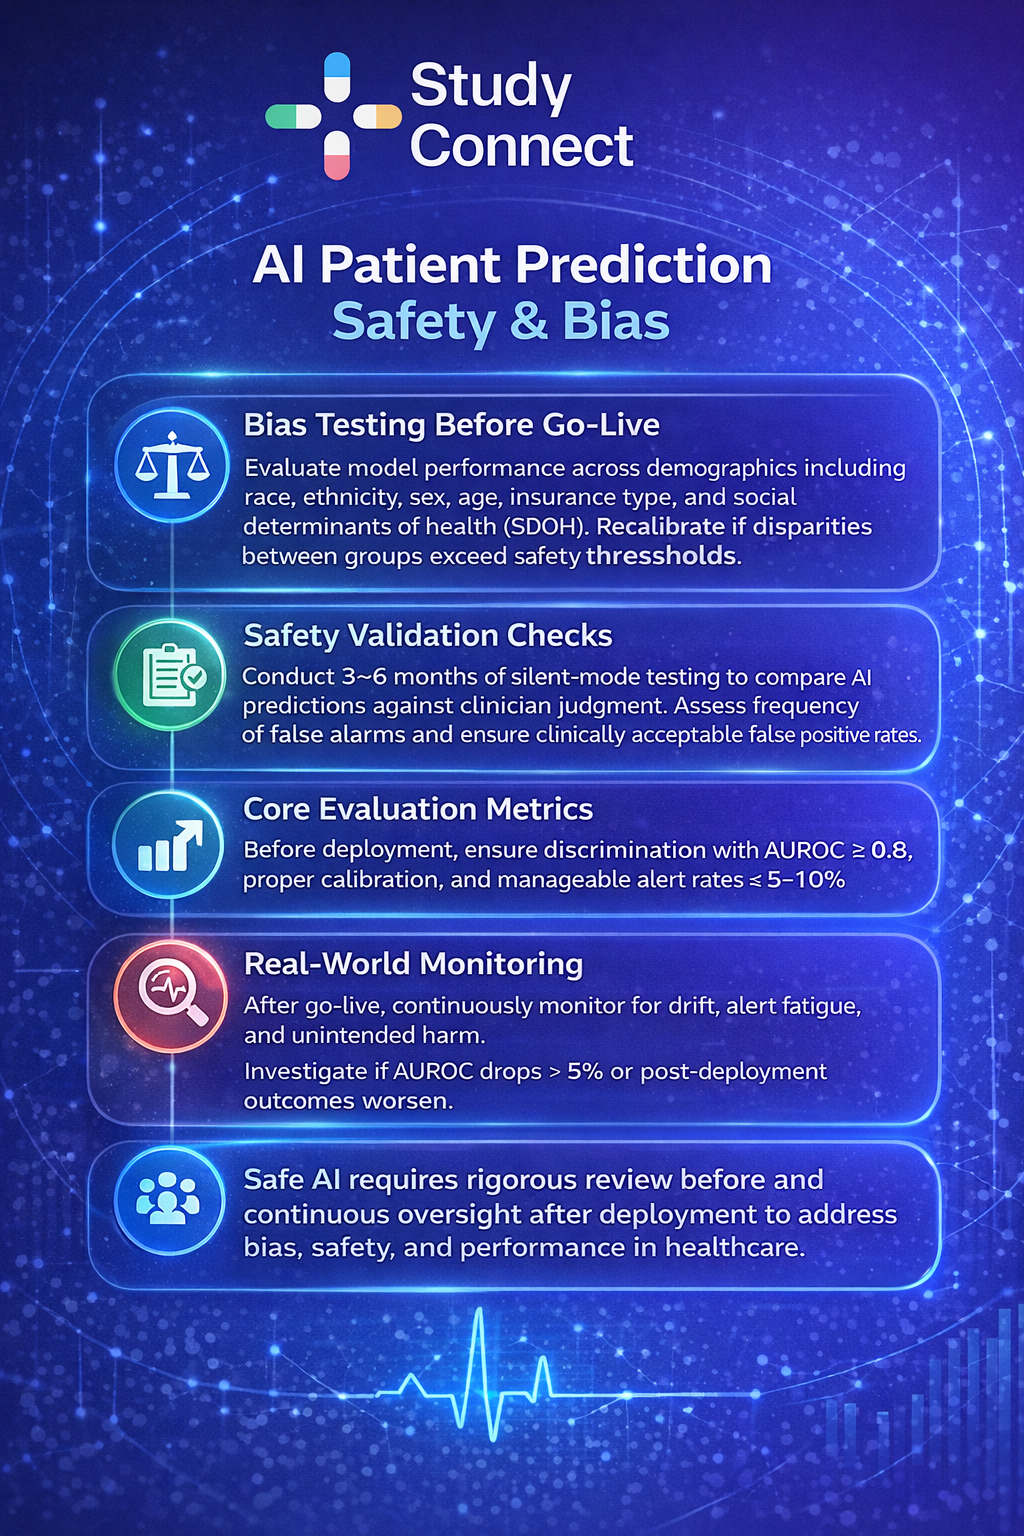
Before go-live, stratify performance by:
· Race and ethnicity
· Sex and gender
· Age groups
· Insurance type
· SDOH proxies (area deprivation, rurality)
Practical safeguards many teams use:
· No subgroup should show >5% AUROC drop vs overall
· Sensitivity differences should stay within 10% absolute across groups
· Calibration slope should be 0.9–1.1
· If thresholds are exceeded, recalibrate or retrain before launch
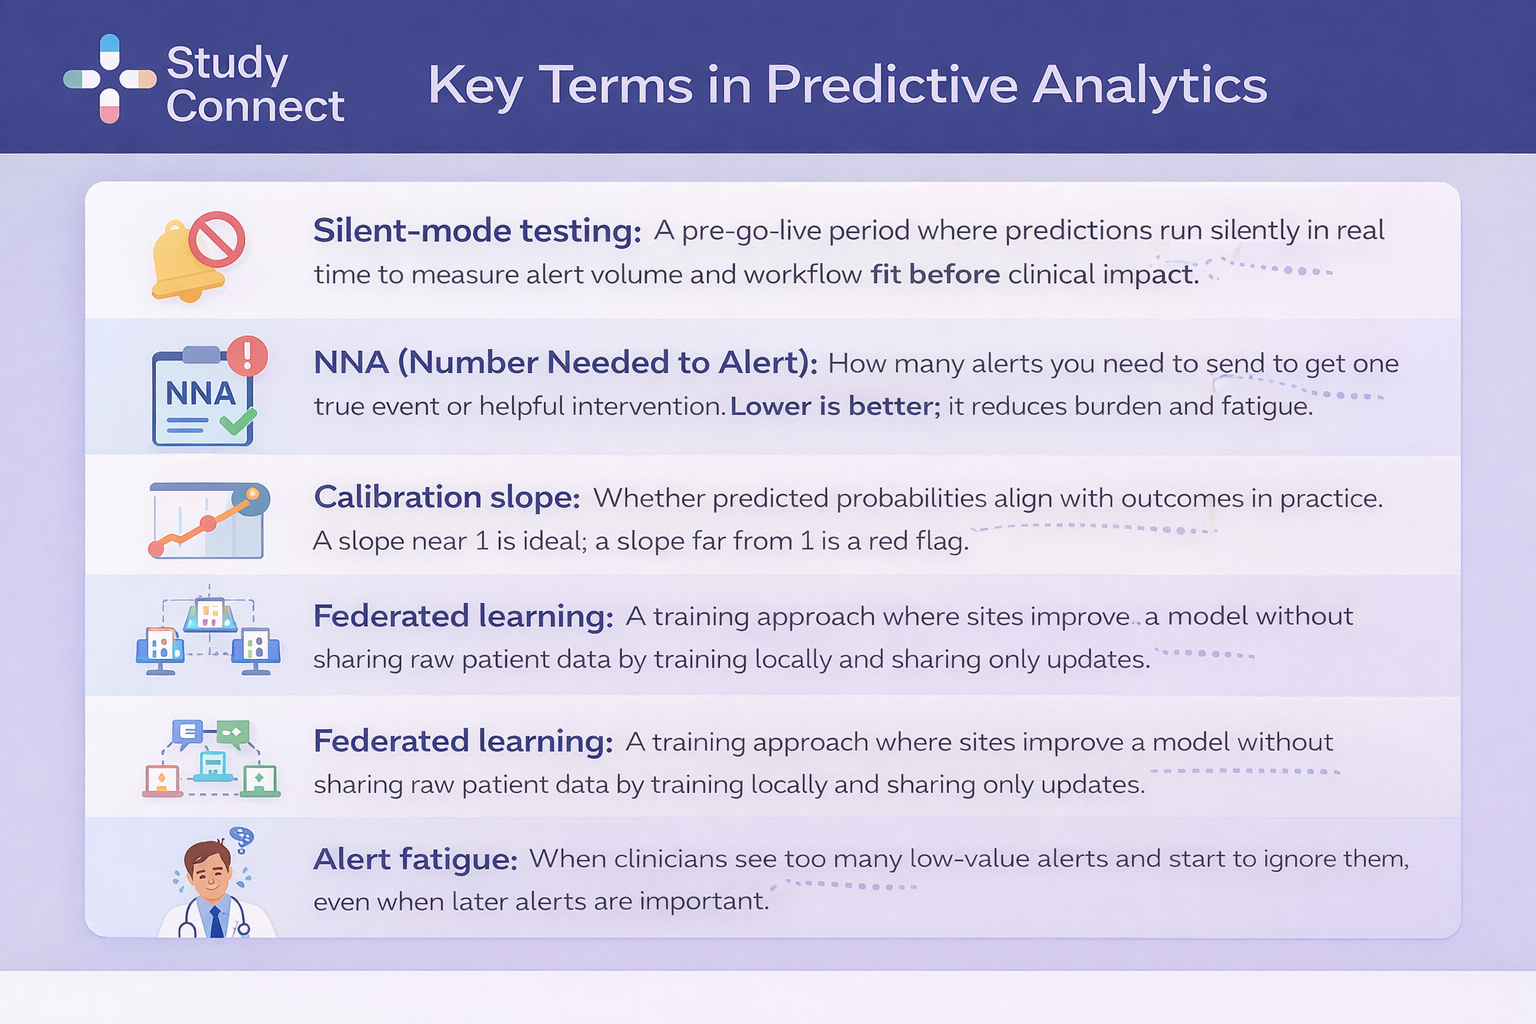
Clinical safety validation should begin with silent-mode testing rather than turning on alerts on day one. In silent mode, the model runs in real clinical time but clinicians do not see the predictions. This allows teams to evaluate real-world performance without risking patient harm from premature alerts. Over a 3–6 month period, organizations typically measure alert frequency by unit and service line, track false positives and false negatives, and calculate the Number Needed to Alert (NNA) to understand operational burden. This phase answers practical questions that metrics like AUROC cannot - such as how many alerts occur per shift, whether they cluster around certain patient groups, and whether staffing levels can realistically handle the volume.
Clear guardrails are essential before go-live. Many systems aim for a positive predictive value (PPV) of 20–30% for high-risk alerts, an overall alert rate below 5–10% of admissions, and no increase in unnecessary interventions such as extra labs, avoidable antibiotics, or unnecessary consults. High override rates -especially above 40–50% - are a red flag and usually signal workflow design issues rather than purely model performance problems.
At the same time, predictive analytics requires strong privacy discipline under HIPAA. Programs should follow data minimization principles, ensure encryption in transit and at rest, implement role-based access controls, maintain detailed audit trails for model outputs and access, and execute vendor BAAs where applicable. Extra caution is required when handling especially sensitive data such as social determinants of health (SDOH) and genomics.
Future Trends in Predictive Analytics
Predictive analytics is moving from pilots to infrastructure. This is not only technology change. It is governance and clinical practice change. Planning for these trends prevents rework.
Federated learning and privacy-preserving AI across hospitals
Federated learning allows hospitals tocollaborate without sharing raw patient data. It can improve generalizability across sites while reducing PHI movement risk.
The hard part is not the math. It is governance:
· Who owns the model updates?
· How do you evaluate performance at each site?
· What is the rollback plan if one site sees harm?
Explainable AI (XAI) as a requirement for Trust and Adoption
Clinicians adopt tools they can sanity-check. That is why XAI is shifting from “nice tohave” to “requirement.”
Practical XAI in hospitals often means:
· Top drivers for risk (recent vitals, labs, meds)
· Short natural-language rationale
· Model cards explaining training data, limitations, and intended use
This also aligns with how healthcare technology leaders expect AI to move from pilots into core infrastructure fordecision support and patient care improvements Source: https://www.healthcareittoday.com/2026/01/14/healthcare-ai-and-patients-2026-health-it-predictions/?utm_source=chatgpt.com
Multimodal Prediction
Multimodal models can improve early detection and personalization by combining:
· Structured EHR data
· NLP from notes
· Imaging signals
· Wearables and remote monitoring
· Genomics
But multimodal also increases complexity:
· More pipelines to monitor
· More drift points
· Harder cross-site generalization
A grounded view helps here. Community discussions often highlight the gap between model performance and real deployment work.
If you want a candid view from practitioners, see this thread : https://www.reddit.com/r/learnmachinelearning/comments/1anwdnf/predictive_ai_analytics_for_healthcare/
A simple starting plan:
· Pick one use case: sepsis, read missions, or AKI
· Define one measurable action:
· Sepsis: antibiotics within a target window
· Readmission: transitional care referral + follow-up completion
· AKI: nephrotoxin review +repeat creatinine plan
· Set alert burden limits:
· Alert rate target <5–10% of admissions for high-risk flags
· Agree upfront on success metrics:
· Outcomes + adoption + drift monitoring triggers
Common Pitfalls to Avoid
Avoid these predictable failure modes:
· Buying a tool without an integration plan into Epic/Cerner workflows
· Skipping local calibration and assuming “out-of-the-box” performance
· Going live without silent-mode testing
· Not testing subgroup fairness and calibration
· No drift monitoring or unclear ownership for updates
· Alerts without clear actions, leading to alert fatigue
Predictive analytics projects need more than data science. You need clinical owners, researchers, and sometimes trial investigators to design evaluation that stands up to scrutiny. If you are building or buying a predictive model, StudyConnect helps teams quickly find and speak with verified clinicians, researchers, and domain experts to validate:
· Clinical feasibility and workflow fit
· Bias and safety review plans
· Study design choices (silent mode, outcomes, endpoints)
· Real-world implementation constraints before go-live
Many teams underestimate how much time is lost talking to the wrong experts. A faster path is structured conversations with the right specialists early. To explore collaboration or get support, reach out to support@studyconnect.org.
For a candid view on how hard AI in healthcare can be in practice, see this discussion: https://www.reddit.com/r/datascience/comments/197dkkz/the_hard_truth_about_artificial_intelligence_in/
References and Useful Reading
· Adams et al., Nature Medicine (2022). TREWS sepsis early warning evaluation (earlier recognition ~1.8 hours; ~18% relative mortality reduction when acted on within 3 hours).
· Market forecast for healthcare predictive analytics growth(https://www.lelezard.com/en/news-22115695.html?utm_source=chatgpt.com)(projects $128.2B by 2033; ~24.3% CAGR).
· Wired’s report on AI digitaltwins for diabetes and obesity (Twin Health)(https://www.wired.com/story/ai-digital-twins-are-helping-people-manage-diabetes-and-obesity?utm_source=chatgpt.com).
· Economic Times report on AIIMSvalidation of Karnataka lung disease screening app(https://m.economictimes.com/news/new-updates/aiims-finds-high-accuracy-in-karnatakas-ai-app-that-screens-lung-diseases-via-smartphone-heres-how-it-works/articleshow/128544474.cms?utm_source=chatgpt.com).
· Report on predictive AIhospital ROI and cost reduction expectations(https://medtechgrowths.com/ai-in-healthcare/predictive-ai-hospital-roi-2026/?utm_source=chatgpt.com).
· 2026 health IT predictions onAI becoming core healthcare infrastructure(https://www.healthcareittoday.com/2026/01/14/healthcare-ai-and-patients-2026-health-it-predictions/?utm_source=chatgpt.com).
· Real-world discussions onpredictive AI analytics in healthcare(https://www.reddit.com/r/learnmachinelearning/comments/1anwdnf/predictive_ai_analytics_for_healthcare/).
· Tool overview: Epic Cogito andCognitive Computing (https://www.epic.com/software/healthcare-intelligence/).
· Tool overview: AmazonHealthLake (https://aws.amazon.com/healthlake/).
· Tool overview: Microsoft Fabric(https://app.fabric.microsoft.com/).
· Tool overview: SAS(https://www.sas.com/).